
Severity
Overview
Severity is the framework for scoring and differentiating the different degrees of risk. We use color, words, and components to communicate severity.
Principles
Simple Risks are complicated and nuanced but categorizing them should be simple. Stick to the determined levels.
Consistent Consistency in our severity framework, like consistency in all other areas of design, helps our users confidently navigate our products. Use the same risk scoring across all products.
Accessible All users should be able to understand and assess risks, regardless of differences in ability.
Contextual Severity scores are contextual, which means risk scores can be higher or lower depending on the business and its specific account privileges. We should approach severity considering these differences.
Dynamic Severity can change once risks are mitigated. While our out-of-the-box solution for scoring is standard, we should remember that our users may have the potential and desire for customization in the future.
Demonstrating severity
Communicating severity with color
Do use the standard colors associated with each risk level — these colors have been researched and tested. Don’t use the same colors between dark theme and light theme.
Try this

Not this

Communicating severity with words
Do always use the same adjectives for the corresponding risk score or privilege level. Don’t use synonyms or alternative words.
Try this
- Low
- Moderate
- High
- Critical
- No Privilege
- Undetermined
Not this
- Mild
- Medium
- Important
- Severe
- Zero
- Unknown
Communicating severity with components
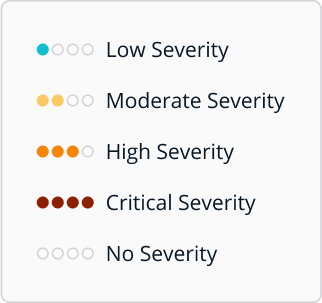
Dots The amount of filled dots corresponds with the risk level. 1 dot is low, 2 dots is moderate, and so on.
Try this
Not this
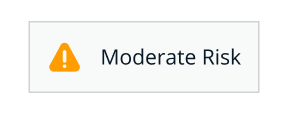
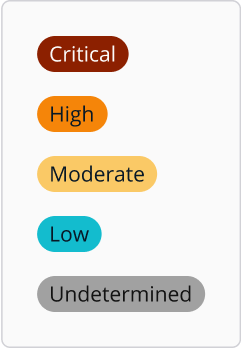
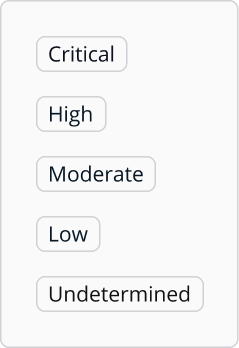
Tags Tags with a label and a color can also communicate severity. Use the correct words and colors mentioned above.
Try this
Not this
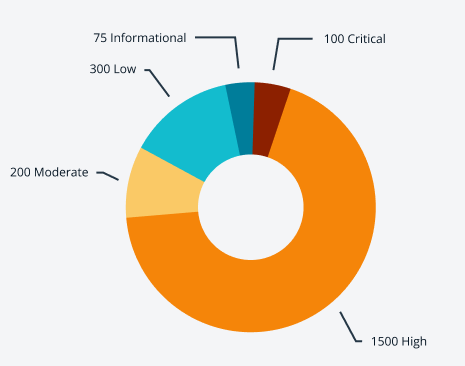
Charts Charts that use the severity colors and labeling to display severity data to the user.
Try this
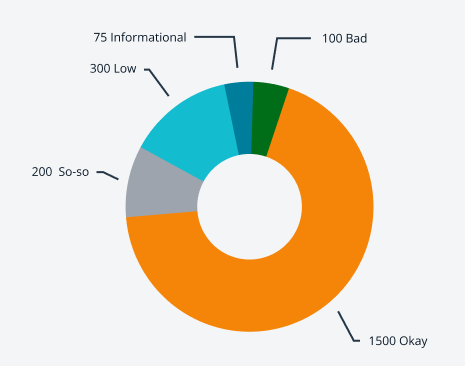
Not this
Related
Referenced in this section: Bar chart component
Updated 4 months ago